





Research reveals pollution exposure can occur during spikes city monitors miss and are often associated with commuting, cooking or hyperlocal traffic patterns.
At a glance
Who: Atmotech (ATMO).
What: Half of New Yorkers’ air pollution exposure happens during spikes city monitors miss, a study by Atmotech finds.
Why: The short spikes are often associated with commuting, cooking, or hyperlocal traffic patterns and can be picked up by personal monitors.
When: Data was collected in New York City between 1 January and 31 December 2025.
Half of New Yorkers’ air pollution exposure happens during spikes city monitors can miss, a study finds. According to the study, these short spikes are often associated with commuting, cooking, or hyperlocal traffic patterns.
Atmotech (ATMO), which specialises in air quality monitoring, analysed 4,128,285 anonymised one-minute PM2.5 readings collected across 8,904 device-days in New York City between 1 January and 31 December 2025.
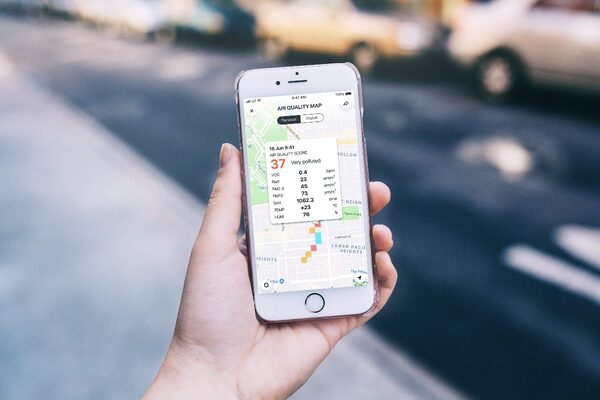
A key finding shows that, in just 43 most polluted minutes (about three per cent of the day), personal device readings are up to 15 times higher than those from the nearest monitoring station during the same period. This suggests that the air quality apps most New Yorkers rely on are failing to account for the critical moments that significantly impact respiratory health.
ATMO claims that New York City’s public PM2.5 dashboard relies on 11 rooftop monitoring stations for its 8.48 million residents, averaging one monitor per 771,000 people. On days when the city-wide daily PM2.5 average was 10 µg/m³, median readings across boroughs were comparable and ranged from eight to 13 µg/m³.
“Since most exposure concentrates in a handful of high-impact moments, identifying and avoiding those specific occasions can meaningfully reduce total intake”
Yet monitoring data from personal devices showed that peak exposure levels varied by location by up to 2.8 times. Peak exposure is measured as the 95th percentile, which represents the highest five per cent of exposure levels. So the baseline air quality appears consistent everywhere, but the pollution spikes affecting the actual personal intake are hyperlocal, highlighting the gap between the average and personalised exposure data.
The fixed rooftop monitoring stations are not distributed evenly. Some boroughs share a single station, while neighbourhoods can be miles from the nearest monitor.
For example, Queens Village and Astoria are both served by the nearest fixed station at Queens College. Yet personal devices in Astoria recorded a 95th percentile PM2.5 of 142 µg/m³, while devices in Queens Village recorded 68 µg/m³. The result is a 108 per cent difference in peak exposure, invisible in the station’s 12 µg/m³ daily average.
Since the study identified hyperlocal personal pollution events, ATMO compared different situations to create a portrait of New York’s highest-exposure day.
The day would most likely be Wednesday, when 22 per cent of all weekly spikes occur. It may start with a morning rush-hour commute, when peak personal PM2.5 exposure was recorded at seven times higher than during night-time hours. The route cuts through a high-density commercial zone like Midtown Manhattan, where devices logged 65 per cent more spike events than in lower-density areas like Staten Island.
By evening, the highest exposure may happen indoors rather than outside. Indoor cooking, especially frying, grilling, or using a gas stove, can raise PM2.5 concentrations to 200-400 µg/m³ within minutes. These levels exceed the World Health Organisation’s 24-hour guideline more than tenfold.
“Since most exposure concentrates in a handful of high-impact moments, identifying and avoiding those specific occasions can meaningfully reduce total intake,” said Vera Kozyr, co-founder and CEO of ATMO. “In practice, this can involve simple steps like avoiding a poorly ventilated kitchen while cooking, choosing a healthier running route, or improving house ventilation.”
ATMO, which develops smart air quality trackers, claims that personal air quality monitoring is following the trajectory of other wearable health metrics. Heart rate, sleep, blood glucose, and heart rate variability (HRV) were originally measured in clinical or professional settings before becoming widely available as consumer health tools.
In the US, 79 per cent of Gen Z consumers already use health technology such as wearables, telehealth, or online prescription services on a monthly basis, while 65 per cent of consumers say they want healthcare to be built around prevention rather than treatment.
ATMO offers two monitoring solutions. Atmocube is an indoor air quality monitor designed for homes and offices. Its IAQ sensors measure key indoor air pollutants PM1, PM2.5, PM10, CO₂, formaldehyde, TVOCs, temperature, humidity, atmospheric pressure, light intensity, and noise levels. Atmotube Pro 2 is built for personal and on-the-go use. It tracks CO₂, NOx, PM1/PM2.5/PM10, VOCs, humidity, temperature, and atmospheric pressure.
The full report can be viewed here.